
Description
Practical data design tips from a data visualization expert of the modern age
Data doesn?t decrease; it is ever-increasing and can be overwhelming to organize in a way that makes sense to its intended audience. Wouldn?t it be wonderful if we could actually visualize data in such a way that we could maximize its potential and tell a story in a clear, concise manner? Thanks to the creative genius of Nathan Yau, we can. With this full-color book, data visualization guru and author Nathan Yau uses step-by-step tutorials to show you how to visualize and tell stories with data. He explains how to gather, parse, and format data and then design high quality graphics that help you explore and present patterns, outliers, and relationships.
- Presents a unique approach to visualizing and telling stories with data, from a data visualization expert and the creator of flowingdata.com, Nathan Yau
- Offers step-by-step tutorials and practical design tips for creating statistical graphics, geographical maps, and information design to find meaning in the numbers
- Details tools that can be used to visualize data-native graphics for the Web, such as ActionScript, Flash libraries, PHP, and JavaScript and tools to design graphics for print, such as R and Illustrator
- Contains numerous examples and descriptions of patterns and outliers and explains how to show them
Visualize This demonstrates how to explain data visually so that you can present your information in a way that is easy to understand and appealing.
From the Author: Telling Stories with Data
 |
Visualization and data design all come easier with practice, and you can advance your skills with every new dataset and project. To begin though, you need a proper foundation and know what tools are available to you (but not let them bog you down). I wrote Visualize This with that in mind.
You ll be exposed to a variety of software and code and jump right into real-world datasets so that you can learn visualization by doing, and most importantly be able to apply what you learn to your own data.
Three Data Visualization Steps:
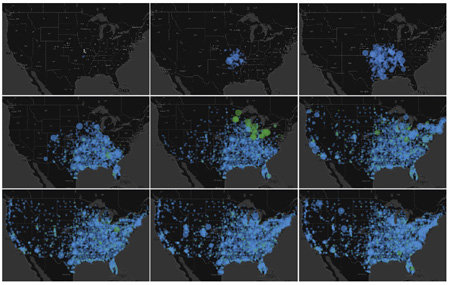
1) Ask a Question
 (Click Graphic to See Larger Version) |
When you get a dataset, it sometimes is a challenge figuring out where to start, especially when it s a large dataset. Approach your data with a simple curiosity or a question that you want answered, and go from there.
2) Explore Your Data
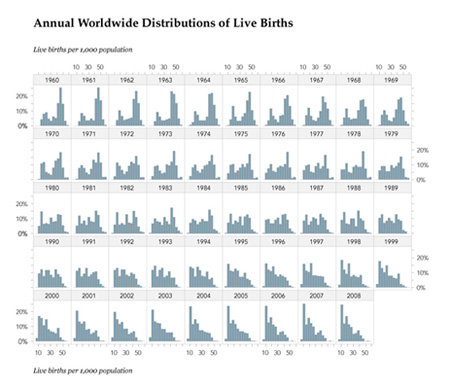 (Click Graphic to See Larger Version) |
A simple curiosity often leads to more questions, which are a good guide for what stories to dig into. What variables are related to each other? Can you see changes over time? Are there any features in the data that stand out? Find out all you can about your data, because the more you know what s behind the numbers, the better story you can tell.
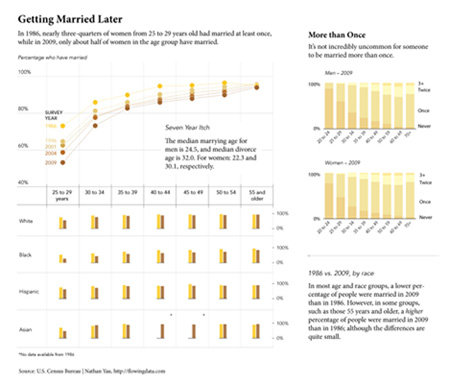
3) Visualize Your Data
 (Click Graphic to See Larger Version) |
Once you know the important parts of your data, you can design graphics the best way you see fit. Use shapes, colors, and sizes that make sense and help tell your story clearly to readers. While the base of your charts and graphs will share many of the same properties – bars, slices, dots, and lines – the final design elements will and should vary by your unique dataset.
Customer FAQs:
Question: I want to order 100% authentic Visualize This: The FlowingData Gui… from your store. How I can place my order in Pakistan?
Answer: Our products are 100% imported and authenticated. To place order just either contact with us or place your order online. One of our sales person contact with you.
Question: Do you have physical store of Visualize This: The FlowingData Gui… in Pakistan?
Answer: No, you can only place order online because we import from USA as get order.
Question: How much more time you will take to deliver, once you get my order?
Answer: After order confirmation we do our best to deliver in 3 to 4 week.
Question: All prices are connfirm and accurate? How I can get exact Visualize This: The FlowingData Gui… price in Pakistan?
Answer: We do our best to list exact prices of all products but since dollar fluctuate in Pakistan so sometime we update at the time of order confirmation.
Question: Is there some discount I will get at the time of placing order?
Answer: For discount we usually send discount coupons. To get discount coupons of Visualize This: The FlowingData Gui… you can sign up our newsletter.
High Quality Goods
We are sourcing products from leading websites in the USA to ensure the highest quality for our end product.
Support
We have a team of professional sales representatives who will assist you in identifying the right products from Amazon.
Express Shipping
Upon receiving your order, we will expedite the shipping process by placing the order promptly and ensuring timely dispatch from the USA.
Secure Payments
Your payment will be securely held with us, and in the event that you receive an incorrect or damaged product, we will issue a refund.